Newert

Collect

Three ways to take the signal

Watch and record with the measurement app, read the markers in Newert Health, or pull the stream straight into your own program with the SDK. All three work from the same band and the same signal.

02Collect

  • Android
  • iOS
  • Windows
  • Linux

Measurement app, dashboard, or SDK

Take the signal as it is, take computed measures, or wire it into your own program

Measure · collect

EmoConnect PPG&Motion

Receives the band's signal over the air, shows it live, and exports a CSV when the session ends. One app is the whole measurement setup.

  • Android
  • iOS
  • Windows
  • Linux

Analyse · dashboard

Newert Health

Shows measures computed from the received signal — from heart rate through to activity and fitness.

  • Android
  • iOS

Build · integrate

EmoConnect SDK

Your own program receives from the band directly, without going through an app. The same SDK covers four operating systems.

  • Android
  • iOS
  • Windows
  • Linux

Measurement app

A measurement stream is gone once it passes

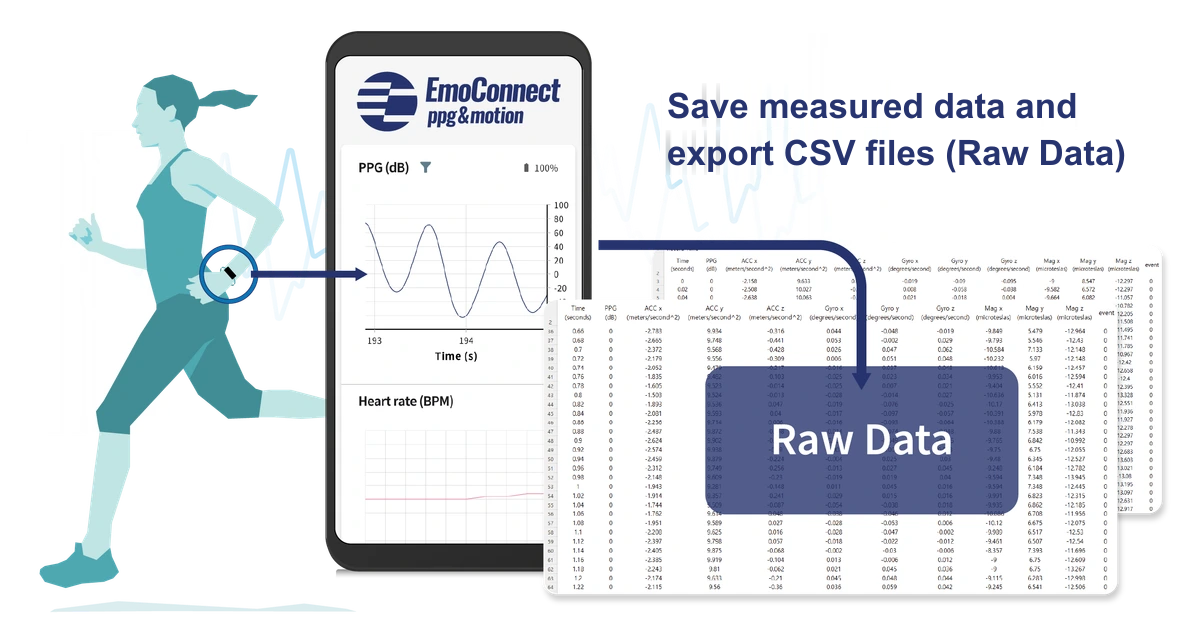
The app binds that stream into session-level records. You watch the waveform while measuring, and export raw data in a standard format when you stop.
  • Pulse wave (PPG) and motion (IMU) live, on one time axis
  • Stores what was measured and exports it as CSV (raw data)
  • Measurement screens shaped to the research protocol
  • The same file format across four operating systems
Measured data is stored and exported as a CSV file (raw data).
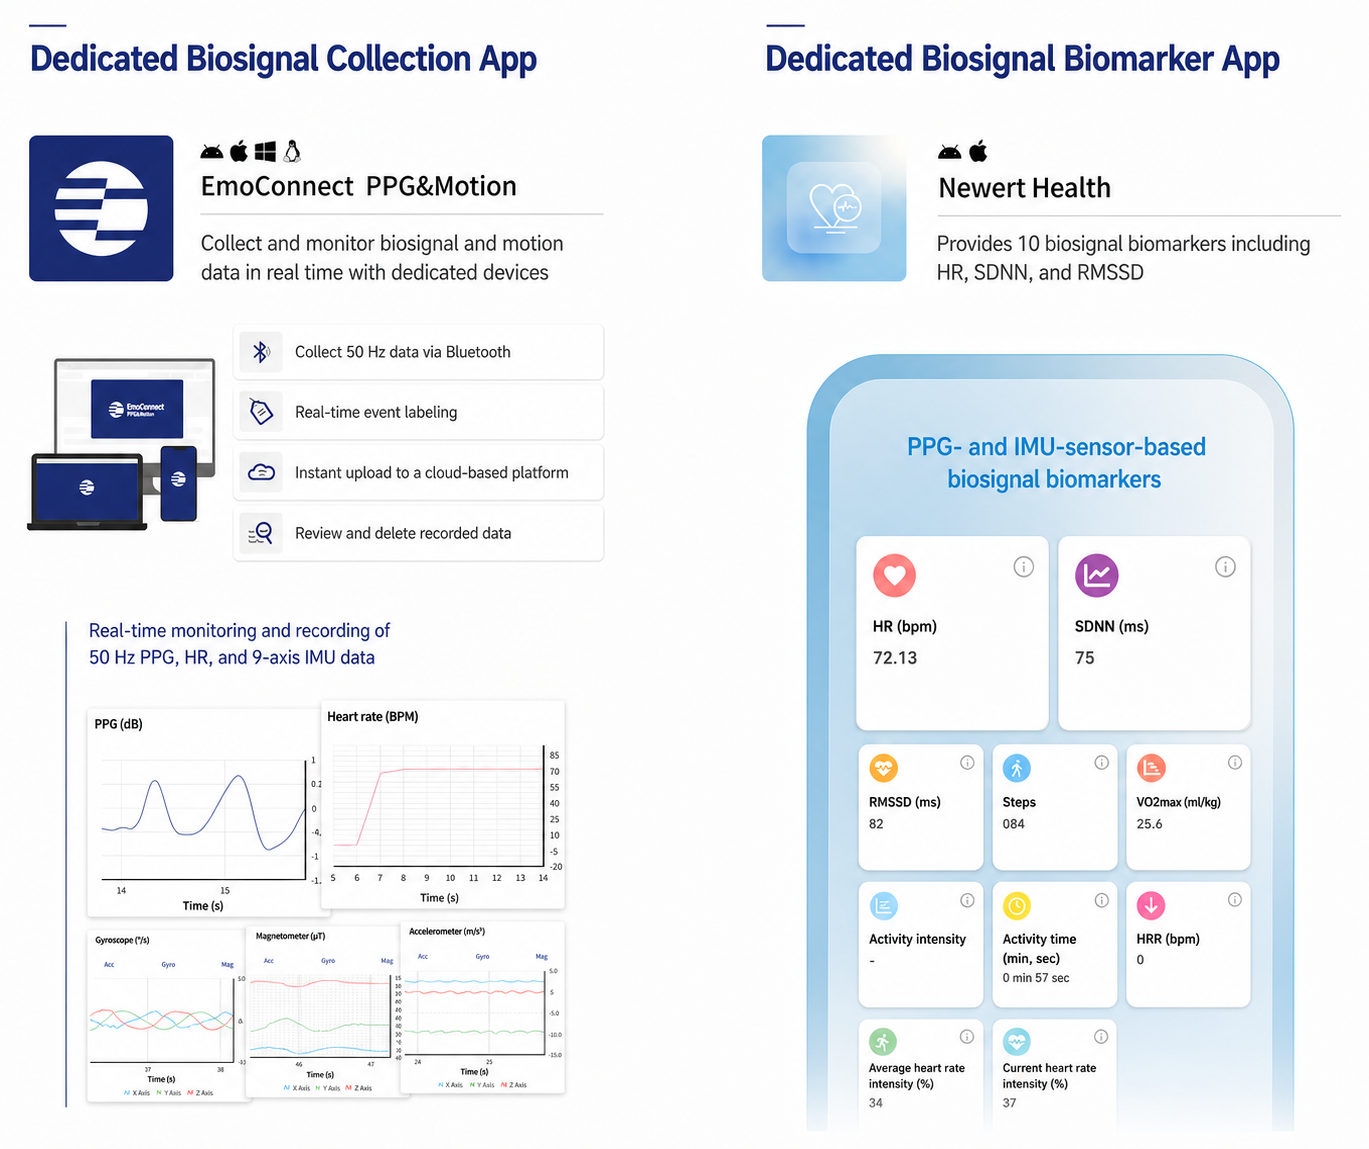
On the left, the measurement app that keeps the signal as it is; on the right, Newert Health showing computed biomarkers. The band is the same either way.

Choose your output

What you receive differs by app

The measurement app provides signals before analysis; Newert Health provides heart, activity, and fitness measures calculated from them. Choose by the output your study needs.

Raw signal2 signal groups + PRO metrics

EmoConnect PPG&Motion

Android · iOS · Windows · Linux

Receives the band's signal in real time and records it as it arrives.

Synchronized raw signals

Real-time PPG signal
Optical blood flow from circulation (dB)
Real-time motion signal
Accelerometer (m/s²) · gyroscope (°/s) · magnetometer (µT)

Advanced PRO metrics

26 advanced HRV metricsPRO
Time-, frequency-, and VLF-domain measures · PRO only

All advanced HRV metrics available with EmoConnect PPG&Motion PRO.

Time domain
5 metrics
  • AVNN
  • SDNN
  • RMSSD
  • SDSD
  • CVNN
Frequency domain · including VLF
21 metrics
  • VLF
  • LF
  • HF
  • TP
  • LF/HF
  • ln(LF/HF)
  • HF/LF
  • (LF+HF)/TP
  • LF/TP
  • HF/TP
  • LFnu
  • HFnu
  • VLF/LF
  • VLF/HF
  • SBI
  • PSI
  • CAB
  • RAI
  • NPI
  • PR
  • AMI

Best suited for

Signal-processing research · source validation · researcher-led analysis

Calculated metrics10 calculated measures

Newert Health

Android · iOS

Measures computed from the received signal — from heart rate through to activity and fitness.

Heart-rate variability

HR
Heart beats per minute (bpm)
SDNN
Standard deviation of inter-beat intervals (ms)
RMSSD
Root mean square of successive interval differences (ms)

Activity measures

Steps
Total steps per day (steps)
Average HR intensity
Average heart rate as a share of maximum (%)
Current HR intensity
Current heart rate as a share of maximum (%)
Activity intensity
Intensity of activity (low / moderate / high)
Active time
Time held at low intensity or above (minutes)

Fitness and recovery

VO₂max
Maximal oxygen uptake (ml/kg)
HRR
Heart-rate recovery measure (bpm)

Best suited for

Dashboard monitoring · health measures · faster interpretation

Research-ready CSV

Know the data structure before opening the CSV

Raw biosignals and motion data share one timeline, ready to move into your existing analysis environment after recording

session_001.csv

Example measurement-session structure

CSV
timestamp, ppg, accel_x/y/z, gyro_x/y/z, mag_x/y/z, event
timestamp
01
Measurement time used to align PPG and motion signals on one timeline
ppg
02
Unfiltered photoplethysmography raw signal
accel · gyro · mag
03
Three-axis accelerometer, gyroscope and magnetometer signals
event
04
Event records used to separate protocol phases and stimulus timing
01

Record by session

Signals and event markers from one study run stay in the same file.

02

Export a standard file

PPG and IMU are exported as a CSV on one shared timeline.

03

Use existing tools

Continue in familiar environments such as Excel, Python, or MATLAB.

The header shown is an example that explains the data structure. Actual column names and available fields may vary by app or SDK version and measurement settings.

Direct integration architecture

  1. 01

    EmoConnect Band

    Measures PPG and IMU signals together.

  2. 02

    EmoConnect SDK

    Delivers the band's data stream to each platform's development environment.

  3. 03

    Your program

    Use it directly in a research app, clinical system, or web service.

Mobile development

Flutter

  • Android
  • iOS

Desktop development

Python

  • Windows
  • Linux

SDK

One SDK, four operating systems

If your study needs to receive from the band directly rather than through an app, connect with the SDK. Flutter for Android and iOS, Python for Windows and Linux — how you receive the signal is the same everywhere.

  • Android · iOS — Flutter
  • Windows · Linux — Python
  • Your own program receives from the band directly
  • The same raw-data format as the measurement app
Binding the signal into your own systemWhat the free tier and PRO each hand over, and how to hand the integration work to us — see stage 05, Apply.

Where to get them

Apps and SDKs are downloaded from the store

They are downloads, so they carry no price. To stack what you measure by experiment, continue to the Datahub.